The top command in Linux is used to display a real-time view of processes that are running in the system. It provides very useful information like CPU utilization, memory consumption, and more, related to every process. But, do you know there exists another command line utility ‘htop’ that provides more information and features when compared with the traditional top command. In this article, we will discuss the ‘htop’ command with examples.
htop command in Linux
Here is an excerpt of htop’s description from its man page :
It is similar to top, but allows you to scroll vertically and horizon‐
tally, so you can see all the processes running on the system, along
with their full command lines.Tasks related to processes (killing, renicing) can be done without
entering their PIDs.
Understand its output first
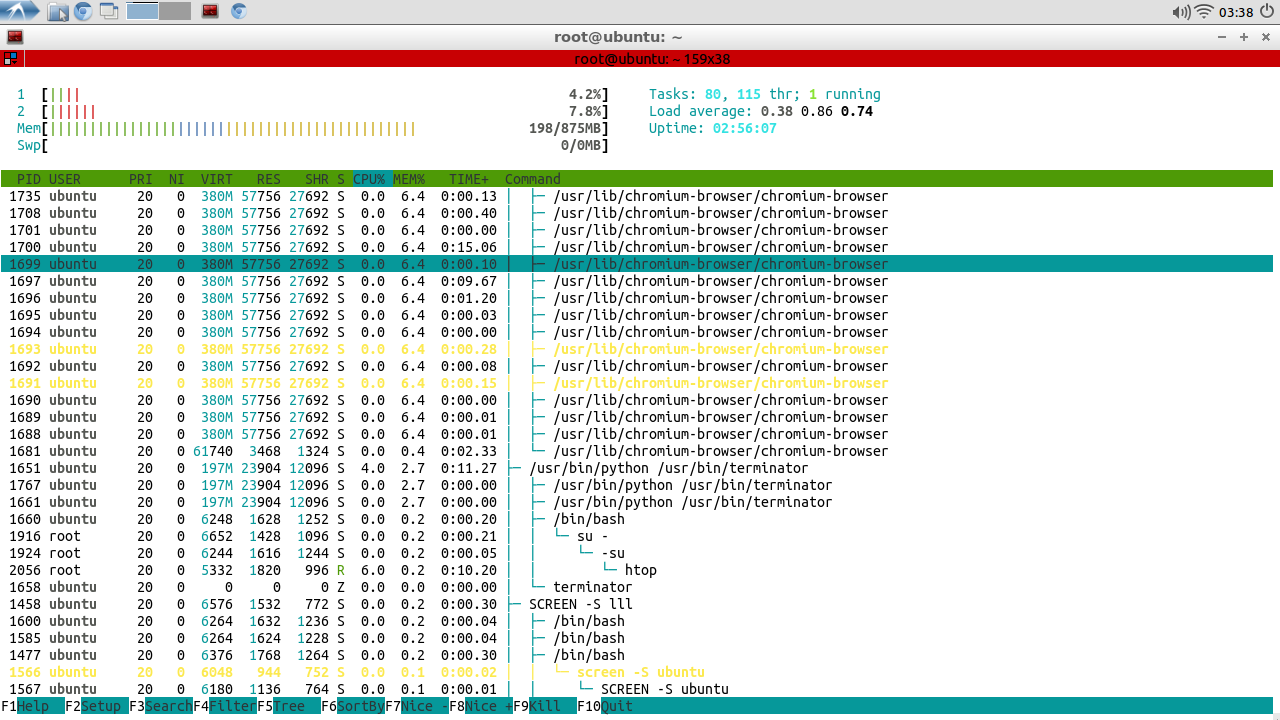
The htop command displays information in a typical format. Here is a snapshot of htop’s output :
If you take a look at the top-left part of the window, you’ll observe real-time information related to CPU load, RAM consumption , and swap. The top-right part contains information related to tasks, threads, load average and uptime.
The load average section provides three figures, which are nothing but load averages calculated for past 5, 10 and 15 minutes. For a single core system, a load average of 1 means 100 percent CPU utilization. And finally, the uptime depicts the time since the system has been up and running.
Now, lets discuss this command through some examples.
1. Edit settings using F2 key
The htop command provides many customization options, all you have to do is to press F2 from the main window.
Here are the customization options available :
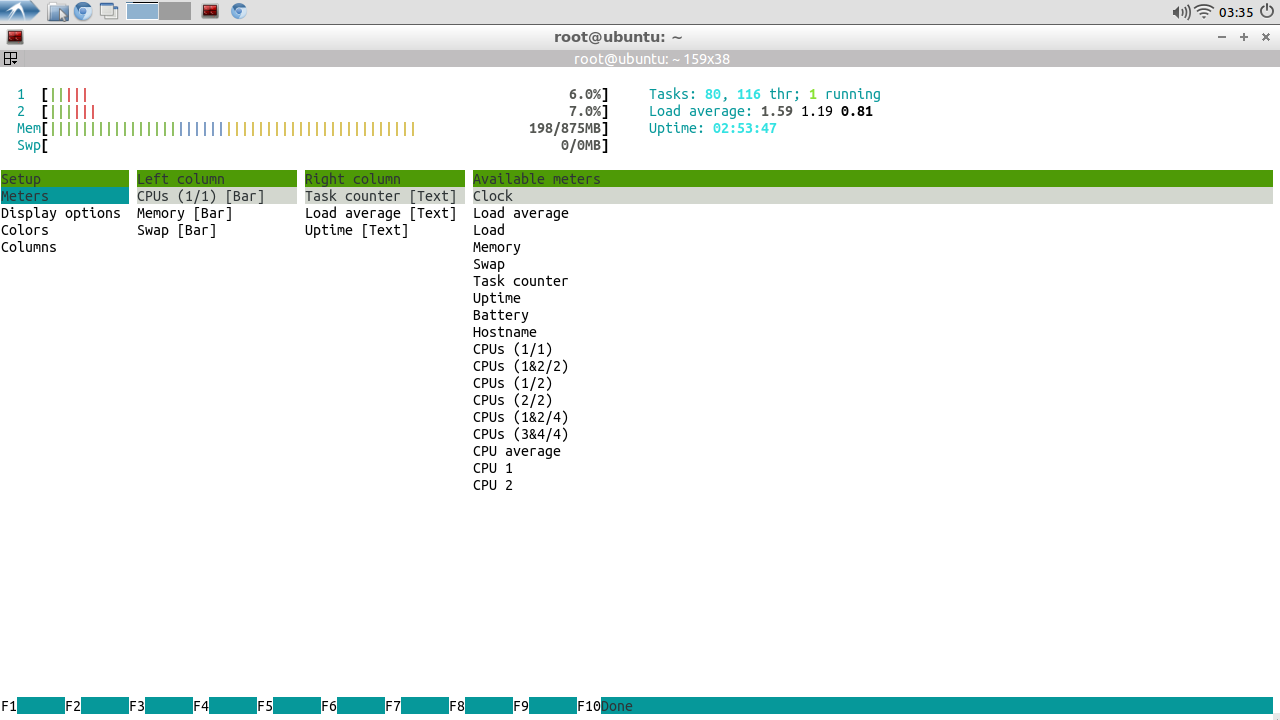
Just use the arrow keys to select and change a particular setting.
2. Send Signals Through F9 key
The htop command provides you with a way through which you can easily send any signal to a process from within the htop window. All you have to do is to press F9.
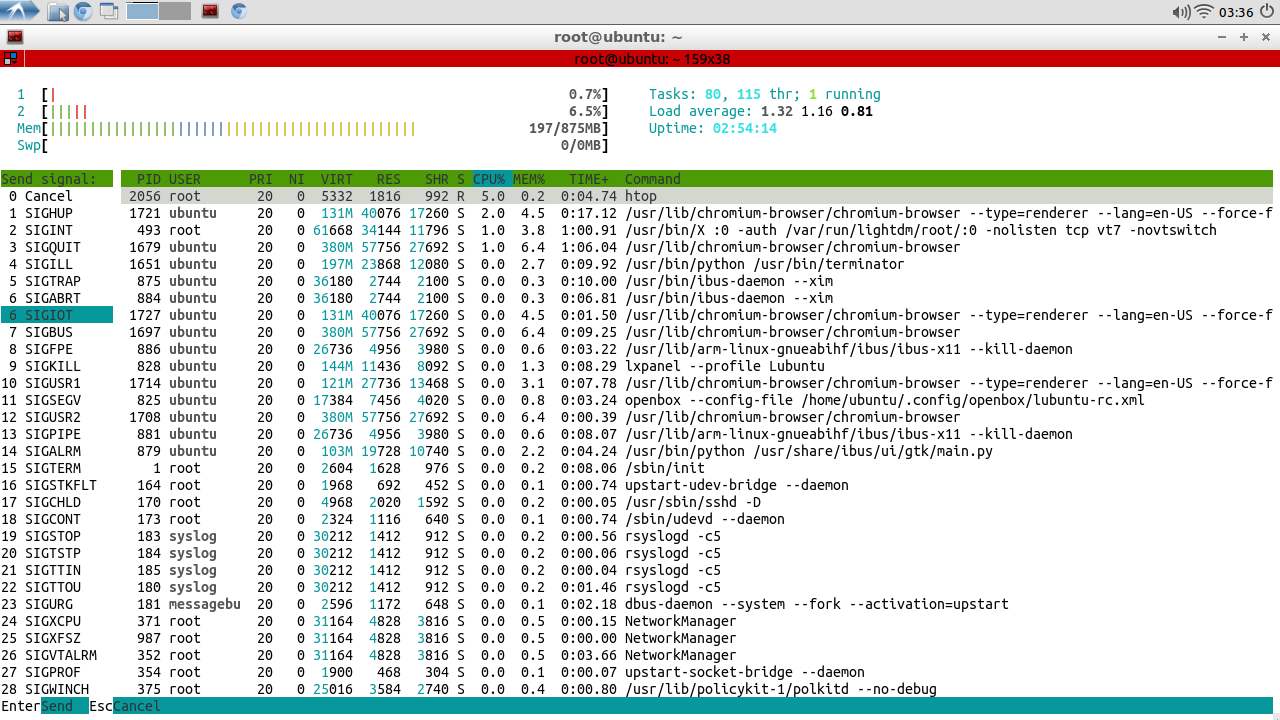 As you can see, the left part of the window now lists all the available signals, while the right part lists the processes. Just select and signal, then select a process, and then press enter to send the signal to the process.
3. Get a tree view of the processes
The htop command also provides a tree view of the processes. All you have to do is to press F5.
Here is an example of htop displaying information in a tree view :
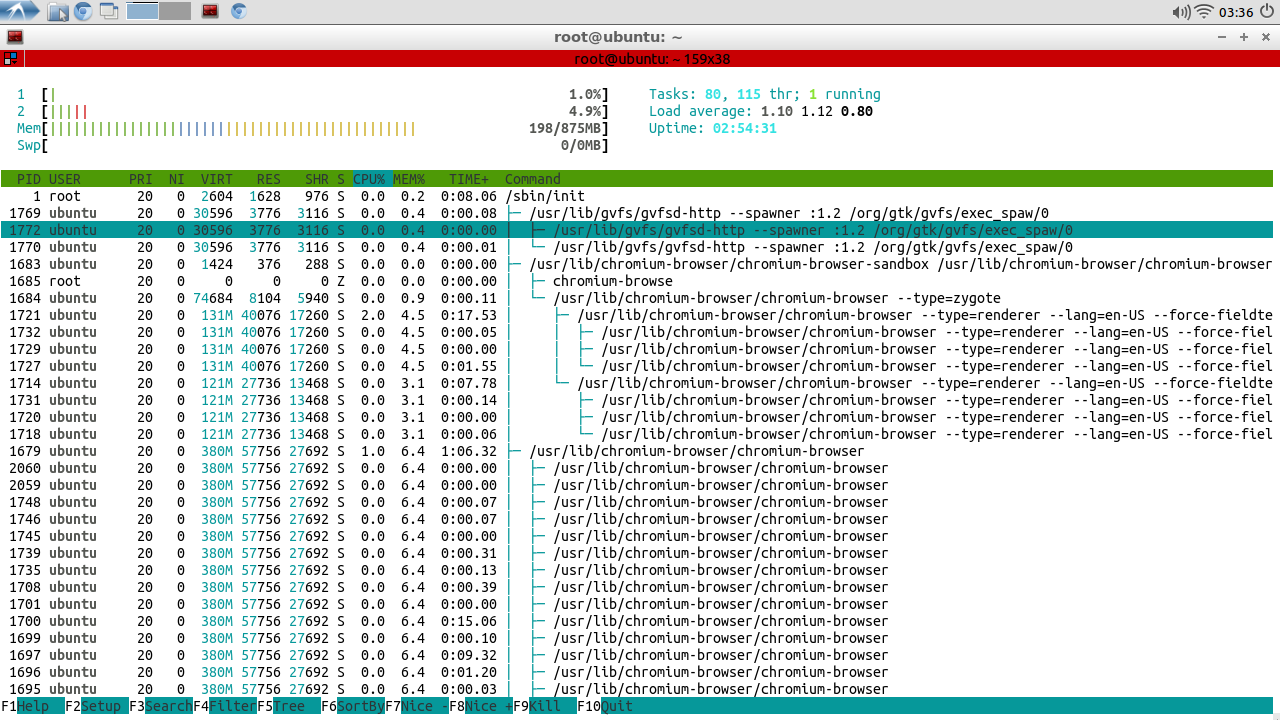
To come out of tree view, press the F5 key again.
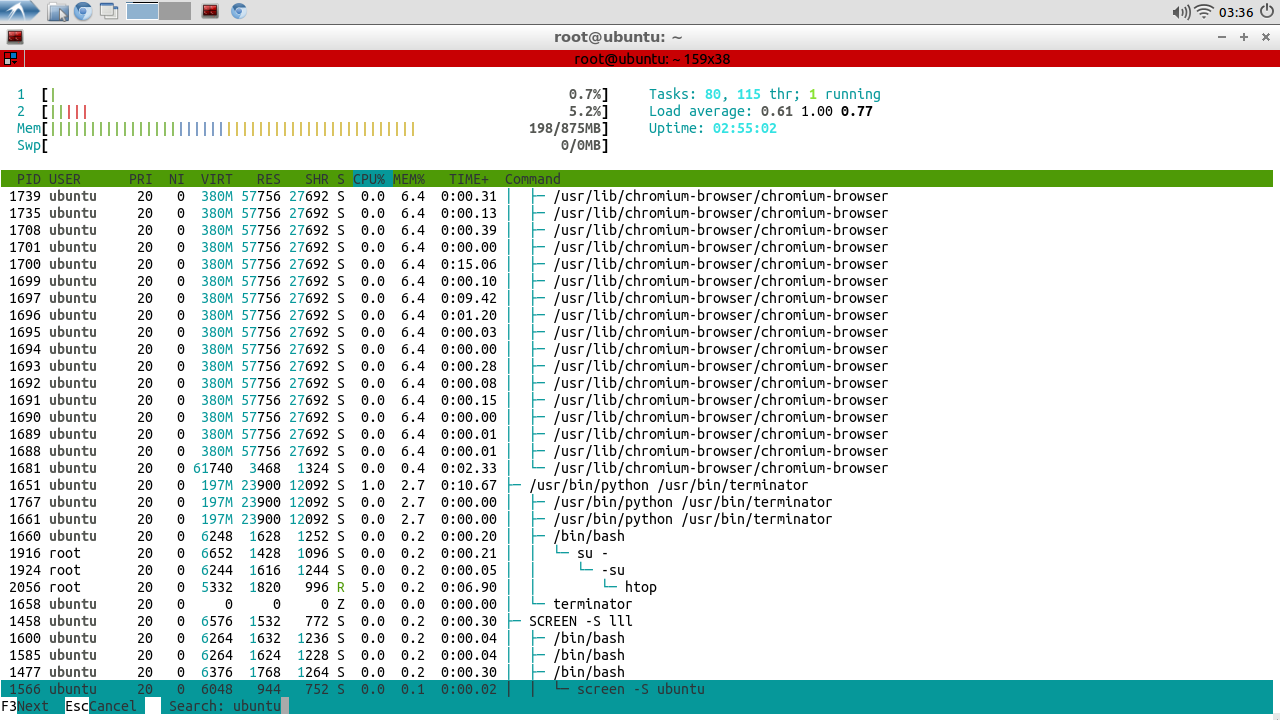
4. Search Processes Through F3 key
The htop command provides an easy way to search processes. All you have to do is to press F3 key and a text box will appear at the bottom of the window.
Here is an example :
As you can see, a text prompt ‘Search’ appears at the bottom of the window. You can type the name of the process here and press enter to search it. If the htop command is able to find it, it will select the entry of that process in its output.
5. Colour Tag An Entry Through Space Key
In real-time view of processes running in the system, one of the main problem is to follow a process. This is because the entries keep on refreshing, and their order keeps on changing. The htop command provides an easy solution to this problem: Colour tagging. Yes, you can colour tag an entry so that it is displayed in a different colour, and hence becomes easy to follow.
To colour tag an entry, all you have to do is to select the entry and press ‘space’ key. For example, in the screen-shot below, I have colour tagged three entries :
So this way, you can easily follow the process(es) you desire.
6. Command line options
Apart from the hot keys explained till now, the htop command also provides useful command line options. Some of them are :
-s Option : To sort a particular column. For example, htop -s PID will sort the PID column output.
-u Option : To display process information related to a particular user. For example, htop -u himanshu will display process information related to the user himanshu.
-d option : To introduce delay between updates. For example, htop -d 100 will make sure that htop output updates after 1 sec (as the argument to -d is considered to be in tenths of seconds).
Comparison between htop and top
- In ‘htop’ you can scroll the list vertically and horizontally to see all processes and complete command lines.
- In ‘top’ you are subject to a delay for each unassigned key you press (especially annoying when multi-key escape sequences are triggered by accident).
- ‘htop’ starts faster (‘top’ seems to collect data for a while before displaying anything).
- In ‘htop’ you don’t need to type the process number to kill a process, in ‘top’ you do.
- In ‘htop’ you don’t need to type the process number or the priority value to renice a process, in ‘top’ you do.
- ‘htop’ supports mouse operation, ‘top’ doesn’t
- ‘top’ is older, hence, more used and tested.
Leave a Reply
You must be logged in to post a comment.