[vc_row][vc_column][vc_column_text]This paper mainly introduces how to use BLE Sensors Tag combined with Science Journal App which is provide by Google to achieve real-time monitoring of sensor data. Through the monitoring of surrounding sensing data, readers can understand the physical world around them by data, open the door to explore science.
 [/vc_column_text][/vc_column][/vc_row][vc_row][vc_column][vc_tta_tour][vc_tta_section title=”Preparation ” tab_id=”1473161418228-04f7beb0-10fd”][vc_column_text]
- An Android Mobile Phone with Science Journal App
- BLE sensors tag provide by LinkSprite company and some matching USB download cable and DuPont line
[/vc_column_text][/vc_tta_section][vc_tta_section title=”BLE sensors tag firmware download ” tab_id=”1473161418311-54f58a80-9a5f”][vc_column_text]BLE sensors tag firmware download and hardware connection instructions.
This section mainly introduces firmware download of BLE sensors tag and the connection of external light intensity sensor, the detailed description of comes sensor of BLE sensor tag can refer to:
http://linksprite.com/wiki/index.php5?title=Mbed_BLE_Sensors_Tag#Schematic
Firmware download:
(1) Connect the usb port of the BLE sensor tag to computers
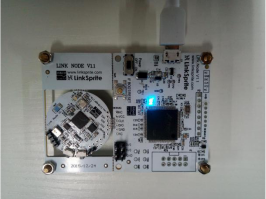
(2) After connecting the computer will automatically find our JLINK disc
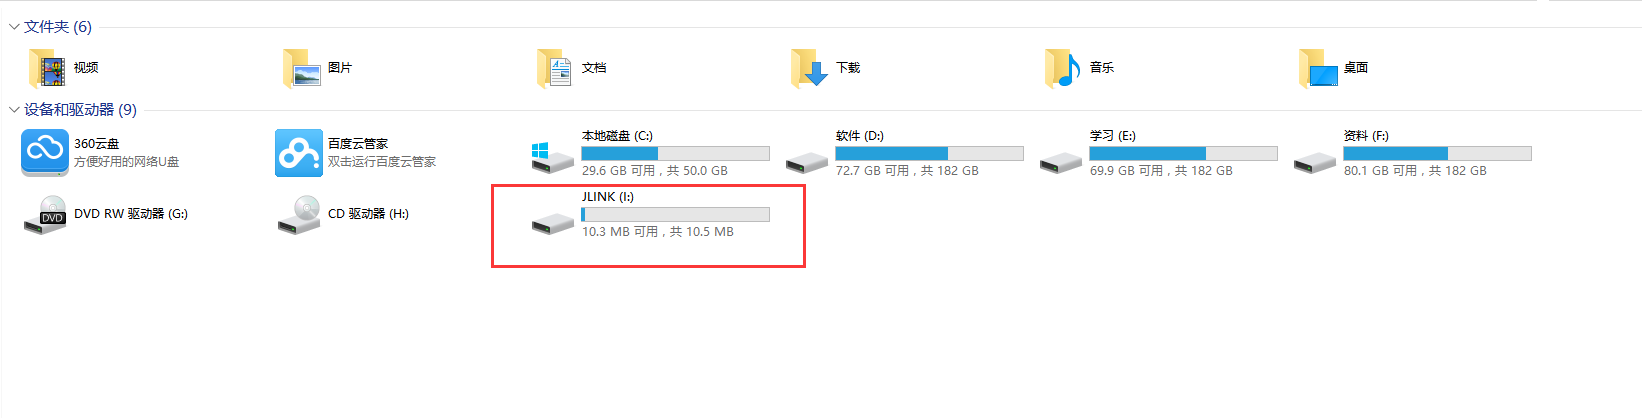
(3) Open JLINK disc, drag the hex file previously downloaded directly to the disc directory, then the letter will automatically disappear for burning program, when the letter appears again in the computer, that the firmware has been downloaded successfully.
Firmware:
nRF51822_Science_Journal_NRF51822.hex
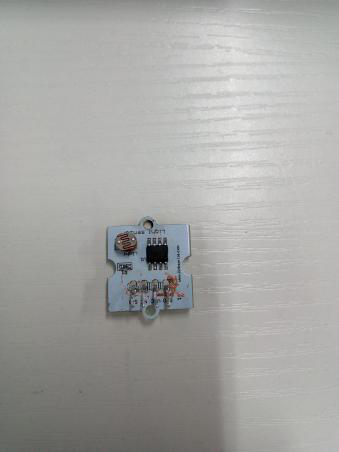
The connection introduction of light intensity sensor:
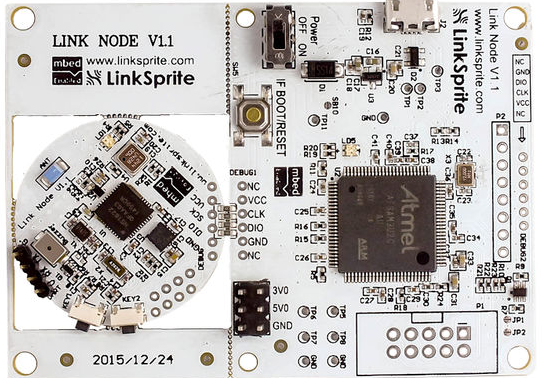
The following left figure shows main pin diagram of BLE sensors tag, the light figure shows intensity sensor we provide.
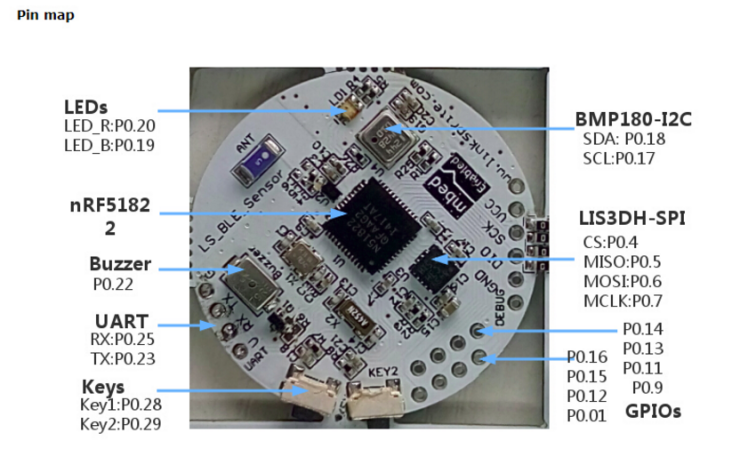
The VCC (3V) and GND of the light intensity sensor are connected to the BLE sensors tag in turn with Dupont Line, the SIG port of the light intensity sensor is connected to the P0.01 of BLE sensors tag , and the connection of the external light intensity sensor is completed.[/vc_column_text][/vc_tta_section][vc_tta_section title=”Journal App Science instructions” tab_id=”1473161427671-1c4c0c99-4787″][vc_column_text]This section will be based on light intensity sensor, temperature atmospheric pressure sensor
, gravity acceleration sensor provide by the BLE sensors tag combined with Journal App Science, to take you to explore the physical world around us.
First determine that your Android phone has been installed Google Science Journal App, BLE sensors tag has also downloaded the firmware.
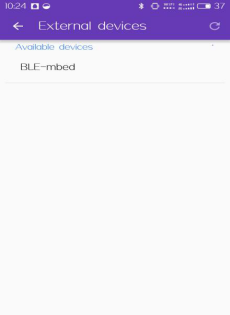
Then open the App, after enter the main interface, it will default display the data of the mobile phone comes with a light intensity sensor, we need to add an external Bluetooth device to show the sensor data of external devices, click “Add peripherals Icon” on the upper right corner of the App, it will display the device name that we use as shown in figure 1, we choose the “BLE-mbed” device, click on connect.
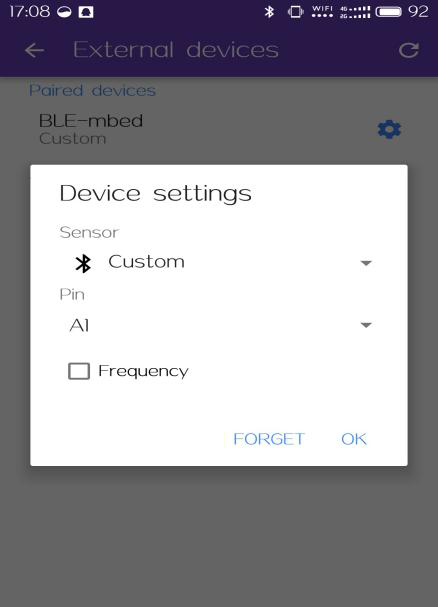
App will show that we have to select the type of sensor data, we select Custom to complete our next data monitoring of sensors. App according to our choice of the pin to determine the sensor we choose.
1 .Data monitoring of light intensity sensor
(1) select A0 in the pin, as shown below, do not check the Frequency, because we are not monitoring the frequency of data, after completing the settings, click OK.

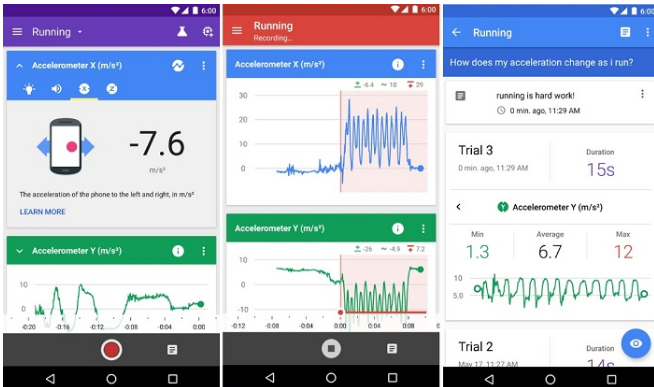
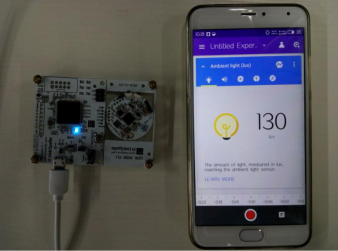
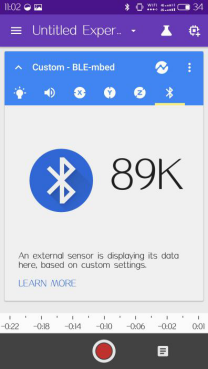
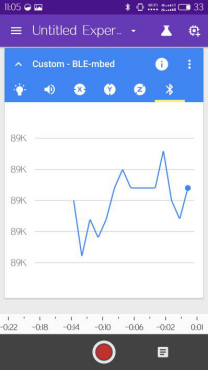
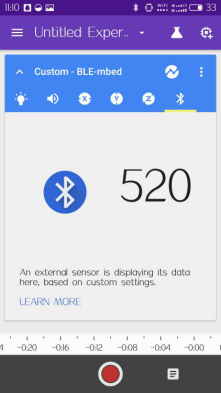
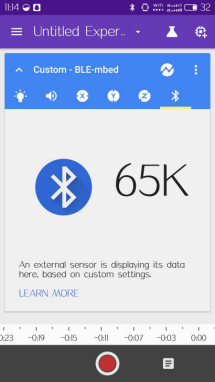
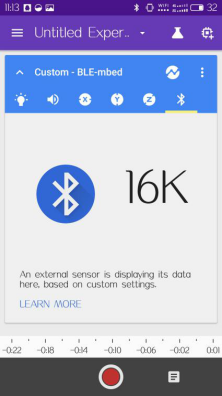
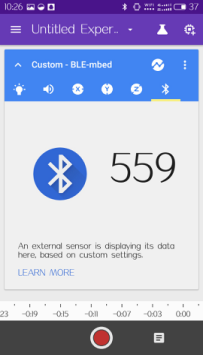
(2)To return to the main interface, click the Bluetooth icon in the sensor bar, and display the intensity level data from 0-65535. Click the waveform icon It can display the light intensity level variation waveform diagram


This completes our exploration of light intensity data.
2. Data monitoring of temperature atmospheric pressure sensor.
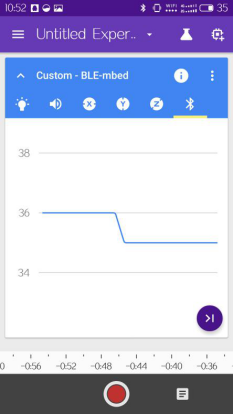
(1) The difference between temperature and atmospheric pressure data monitoring and light intensity sensor data monitoring is set different pin, set A1 to pin is the temperature data, set pin to A2 is atmospheric pressure data, the specific settings can refer to 2.1. After setting, we can observe the change data of indoor temperature from the App, and the change of atmospheric pressure in the room.
Temperature:

Atmospheric pressure:
3.Data monitoring of gravity acceleration sensor
Select pin for A3 is the X axis acceleration change, select pin for A4 is Y axis acceleration change, select pin for A5 is Z axis acceleration change.
When we move the target board along the X axis, we see a significant change in the data.
When we move the target board along the Y axis, we see a significant change in the data.
When we move the target board along the Z axis, we see a significant change in the data.

4. Recording of experimental observation data
This section takes the light intensity data as an example, and introduces how to use App to record the experiment data.
(1) when we monitor a sensor data, you can click on the red button at the bottom of the App to start recording an experimental data. Click on the cray button at the bottom of the APP to end an experiment record.
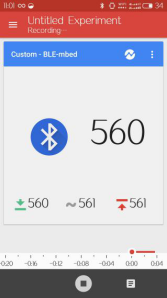
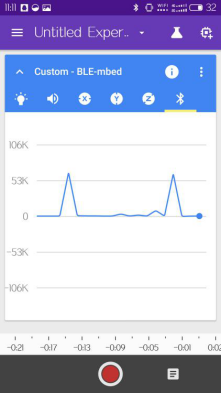
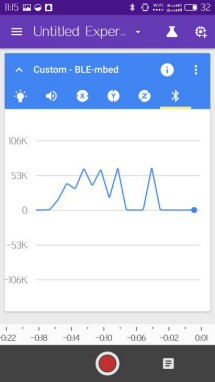
(2) Eventually it will automatically generate a data chart of experimental record, this can be used to analyze the trend of data change of the selected sensor.
5.Expansion: using light intensity sensor to achieve monitoring of rotational speed
This section describes how to use light intensity sensor to achieve monitoring of rotational speed, as shown in Figure 2.4.1 , the light intensity sensor is stacked in a simple speed measurement device , the measurement device is mainly composed of two small round cardboard, A leakage of photosensitive resistance head from the below wafer, A leakage of sector of the aperture a from above wafer, and fix the shaft with the above wafer, when the above wafer follow the rotary shaft to rotate., specific speed data will display on speed test interface.
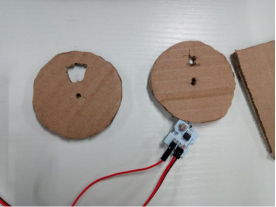
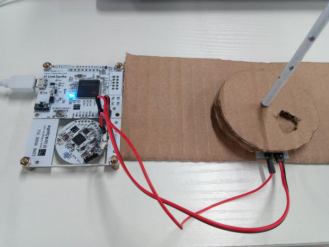
Specific speed measurement device production can refer to:
Next, we will introduce the monitoring of rotational speed:
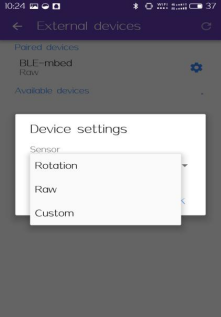
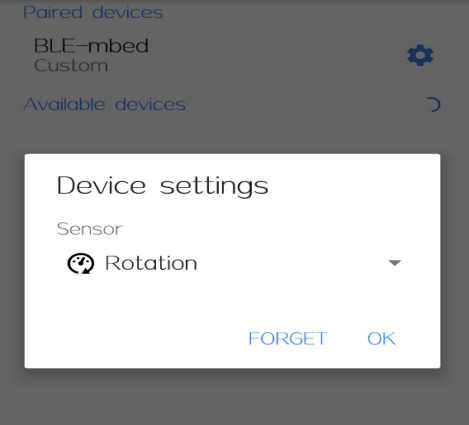
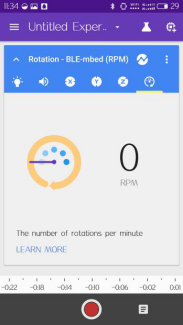
(1) Open App, connect to our external Bluetooth device, and enter the settings, select the Sensors type: Rotation, click OK.
(2) Return to the main interface, we will see that the rotating speed is 0 in different rotating shaft.
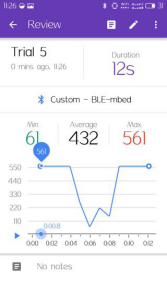
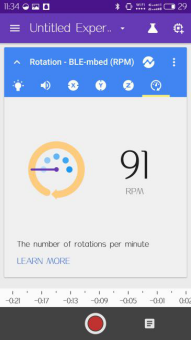
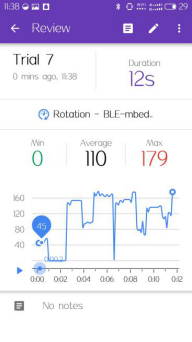
(3) When we rotate the rotating shaft, we can clearly see the speed change, we also recorded the experimental data of the speed change at a period of time.
 [/vc_column_text][/vc_tta_section][vc_tta_section title=”Resource” tab_id=”1473161429227-496141f2-962c”][vc_column_text]Google Science Journal
https://s3.amazonaws.com/linksprite/demo_22534/Google+Science+Journal+1.1.107.apk
NRF51822 Science Journal
https://s3.amazonaws.com/linksprite/demo_22534/nRF51822_Science_Journal_NRF51822+.hex[/vc_column_text][/vc_tta_section][/vc_tta_tour][/vc_column][/vc_row]
Leave a Reply
You must be logged in to post a comment.